
The most effective application monitoring approach is an SLO-driven, end-to-end telemetry strategy that combines metrics, traces, logs, real user monitoring, and synthetic checks. Teams that adopt it move faster because alerts point to real user impact instead of noisy host metrics. Start by declaring SLOs and error budgets, instrumenting critical paths with OpenTelemetry, wiring alerts to SLO burn rate, layering in RUM and synthetic coverage, and writing runbooks before the first incident hits.
TL;DR:
- Teams should focus on SLO-based telemetry, instrument critical paths early, and layer in real user monitoring and synthetic checks for comprehensive coverage.
- Alerts must tie to SLO burn rates instead of raw thresholds, and dashboards should be tailored for incident, investigation, and business analysis.
- Use tail-based sampling for traces to balance diagnostic value with cost, and preserve error or outlier traces longer for postmortem analysis.
- Distributed tracing, consistent metadata tagging, and dependency mapping are essential for managing microservice architectures effectively.
- Regularly revisit telemetry costs, security, and privacy policies, and ensure alerting and escalation processes are precise and action-oriented.
Table of Contents
- Application Monitoring Best Practices: A Prioritized Checklist
- What Types of Monitoring and Telemetry Should You Collect?
- How Do You Choose the Right Metrics and Set SLO Targets?
- Instrumentation Practices: OpenTelemetry, Auto-Spans, and Manual Context
- RUM vs Synthetic Monitoring: When to Use Each
- Alerting, Runbooks, and Incident Workflows That Actually Work
- Dashboards and On-Call Views: What Each One Should Answer
- Sampling, Cost Control, and Data Hygiene
- How Should You Evaluate and Choose Monitoring Tools?
- Your 30/90/180-Day Rollout Plan for Monitoring Maturity
- Data Retention Policies and Storage Management
- Security and Privacy Considerations in Application Monitoring
- Common Pitfalls and Anti-Patterns to Avoid
- Monitoring Distributed and Microservices Architectures
- What Requestum Has Learned Building Observable Systems
- How Requestum Helps You Implement These Practices
- Sources
Application Monitoring Best Practices: A Prioritized Checklist
Most teams monitor everything and understand nothing. The fix isn't more dashboards, it's sequencing the work correctly so each layer of telemetry earns its keep before you add the next one.
- Declare SLOs and error budgets first. Without a target for acceptable failure, every alert is a guess. Pick two or three critical user journeys and write an SLO for each this week.
- Instrument the critical path before anything else. Auto-instrumentation gets you traces and metrics fast; add manual spans only where business logic actually lives.
- Cover the four signal types: metrics, traces, logs, RUM. Skipping one leaves a diagnostic blind spot you won't notice until an incident forces the issue.
- Build SLO-based alerts, not threshold alerts. A CPU spike that doesn't hurt users shouldn't page anyone at 2 a.m.
- Add synthetic checks for your top five transactions. They catch regressions before real users do.
- Automate what you can in CI/CD. Performance budgets and synthetic checks belong in the pipeline, not just in production.
- Apply sampling deliberately. Full-fidelity tracing on every request is rarely affordable once traffic scales; tail-based sampling protects error visibility while cutting cost.
Pro Tip: *If your on-call engineer mutes a Slack channel, that's not an alerting problem, it's a signal your thresholds are wrong.
The balance between telemetry richness and cost is not a one-time decision. Revisit it every quarter as traffic and architecture change, because what was affordable at 10,000 requests a day becomes a budget line at 10 million.
What Types of Monitoring and Telemetry Should You Collect?
Different telemetry types answer different questions, and conflating them is where most monitoring strategies go wrong. Metrics tell you "how much" or "how often." Traces tell you "where did the time go." Logs tell you "what exactly happened." RUM tells you "what did this affect for real users." Synthetic checks tell you "is the system even reachable right now."
- Metrics: aggregated numbers (latency, error rate, throughput) ideal for dashboards and trend detection over time.
- Logs: structured, timestamped events that reveal the specific error, stack trace, or state change behind an anomaly.
- Traces: request-level maps across services, essential for locating the exact hop causing latency in a distributed system.
- RUM (Real User Monitoring): captures actual session data from real devices and networks, showing the "ugly truth" of production performance that lab tests never reveal, according to The New Stack's analysis of synthetic monitoring.
- Synthetic monitoring: scripted, scheduled checks from controlled locations that catch certificate expirations and regional CDN failures before customers do.
- Profiling: continuous CPU and memory sampling that pinpoints the specific function or query burning resources.
The pairing pattern that resolves most incidents fastest: a trace flags the slow span, a log search on that trace ID reveals the exact exception, and a metric dashboard confirms whether it's isolated or systemic. Ownership matters too. Application teams should own traces and logs for their services; platform or SRE teams typically own aggregate metrics and synthetic coverage across the fleet.
How Do You Choose the Right Metrics and Set SLO Targets?
Three frameworks cover almost every monitoring gap: RED (Rate, Errors, Duration) for request-driven services, USE (Utilization, Saturation, Errors) for infrastructure resources, and the four golden signals (latency, traffic, errors, saturation) from Google's SRE discipline. Map each to a real user journey. "Checkout completion" isn't abstract if you tie RED metrics to that specific endpoint.
Averages lie. That's why tracking p95 and p99 percentiles matters more than mean response time when protecting user experience. Pick your transactions deliberately: the login flow, the payment endpoint, the search query, anything where a slowdown directly costs revenue or trust.
Writing an SLO is simpler than most teams make it:
- Pick the journey: "User completes checkout."
- Pick the metric: p99 latency under 800ms, or success rate above 99.9%.
- Pick the window: measured over a rolling 28-day period, not a single day.
- Calculate the error budget: 99.9% availability over 28 days allows roughly 40 minutes of downtime. That budget is your currency for risk.
Once the SLO exists, alerting logic changes completely. Instead of "CPU over 80% for five minutes," you alert on burn rate: "we've consumed 25% of this month's error budget in six hours." That single shift, tying alerts to SLO burn rather than raw thresholds, is what separates teams that get paged for noise from teams that get paged for things that matter.
Instrumentation Practices: OpenTelemetry, Auto-Spans, and Manual Context
Start with auto-instrumentation. Most modern APM agents and the OpenTelemetry SDKs will capture HTTP calls, database queries, and queue operations with a few lines of setup, and that alone typically covers a large share of what you need for diagnosis, per Elastic's APM best practices guide. Manual spans come next, reserved for the operations that actually matter to the business: a pricing calculation, a fraud check, a multi-step order confirmation.
- Adopt OpenTelemetry as your instrumentation standard. It avoids vendor lock-in and lets you swap backends without re-instrumenting every service.
- Add manual spans only for business-critical logic. Auto-instrumentation handles infrastructure calls; humans need to mark what matters to the product.
- Propagate trace context across service boundaries. Without it, a single user request across five microservices looks like five unrelated events.
- Structure your logs and embed trace IDs in every entry. A log line with no trace ID is a dead end during an incident.
- Tag every span and log with release version. When a regression appears, "what changed" is the first question, and version tags answer it instantly.
Pro Tip: Document instrumentation decisions the same way you document API contracts. When a new engineer asks "why is this span named that way," a one-line comment in a shared wiki saves an hour of Slack archaeology six months later.
Version your telemetry schema too. Renaming a metric or restructuring a log field without warning breaks every dashboard and alert built against the old shape, usually discovered at the worst possible time.
RUM vs Synthetic Monitoring: When to Use Each
RUM and synthetic monitoring solve different problems, and treating them as interchangeable is a common mistake. RUM captures what real users actually experienced, across whatever device, browser, and network condition they happened to have, according to MDN's comparison of the two approaches. Synthetic monitoring runs scripted, repeatable checks from fixed locations, which makes it ideal for catching regressions before a single real user hits them.
- Use RUM to understand distribution. It segments by device, region, cache state, and release, exposing cohorts synthetic tests would never catch.
- Use synthetic checks for pre-deploy and availability validation. Run your top five to ten user flows every one to five minutes from at least two or three geographic regions.
- Set synthetic cadence around risk. Payment and login flows deserve tighter intervals than a static marketing page.
- Combine both for triage. A synthetic alert tells you something broke; RUM tells you how many users and which segment got hurt.
- Confirm root cause with traces. Once RUM or synthetic data flags a regression, tracing pinpoints the exact backend call responsible.
Mature teams don't choose one over the other. They use synthetic checks as an early warning system and RUM as the ground truth for actual impact.
Alerting, Runbooks, and Incident Workflows That Actually Work
An alert without an action is just noise with a badge. Every alert should specify severity, the owning team, what evidence to pull first, and a reversible next step, whether that's a rollback, a traffic shift, or a feature flag flip, according to DevOps AI Toolkit's breakdown of observability practices.
- Base alerts on SLO burn rate, not raw infrastructure metrics. A memory spike that doesn't threaten the error budget doesn't need a human at 3 a.m.
- Attach a short runbook to every alert. Three to five steps: what to check, who to escalate to, and what a safe rollback looks like.
- Assign explicit ownership per alert. "Someone will see it" is not an escalation policy.
- Run quarterly incident drills. Simulate a failure and time how long it takes the on-call engineer to find the runbook, not just resolve the issue.
- Review your alert history monthly. Any alert acknowledged but not acted on more than a handful of times belongs in the trash or needs a new threshold.
Pro Tip: Keep runbooks inside the same repo as the service they describe. A runbook stored in a wiki three clicks away from where engineers actually work gets ignored during a real incident.
Escalation policies deserve the same rigor as the alert logic itself. If the first responder doesn't acknowledge within a defined window, say five minutes, the page should automatically widen to a secondary on-call and eventually a team lead. Coordinating that escalation alongside sprint and bug tracking is easier with a shared engineering view; teams using Jira for tracking incidents alongside sprint work often close the loop between "alert fired" and "ticket resolved" faster than teams juggling separate tools.

Dashboards and On-Call Views: What Each One Should Answer
A dashboard exists to answer a specific question fast, not to display every metric your telemetry pipeline collects. Build three distinct dashboard types, each serving a different moment in the incident lifecycle.
- On-call dashboard: current SLO status, error budget remaining, active alerts, and a list of recent deploys. Its job is to answer "is something broken right now, and did we just ship it?"
- Developer investigation view: linked traces, a log search box pre-filtered by service, and p95/p99 latency broken out by endpoint. Its job is to answer "where exactly is the problem?"
- Business or product dashboard: conversion rates, checkout completion, and user-facing availability trends over weeks or months. Its job is to answer "did this incident actually cost us anything?"
Every dashboard panel should link directly into a trace search or log query filtered to that time window; if an engineer has to manually copy a timestamp into a different tool, the dashboard has failed its purpose. Resist the urge to add "just one more panel." A dashboard with 40 metrics gets glanced at once and ignored forever; a dashboard with six well-chosen panels gets used during every incident.
Sampling, Cost Control, and Data Hygiene
Full-fidelity tracing sounds appealing until the storage bill arrives. Head-based sampling, deciding whether to keep a trace at the moment a request starts, is cheap but risks discarding exactly the slow or failed requests you need most. Tail-based sampling waits until a request finishes, then keeps traces that show errors or high latency while discarding routine successful ones, which Elastic recommends as the more diagnosable approach for services with meaningful error rates.
- Instrument entry points first. API gateways and load balancers give you the broadest visibility for the least instrumentation effort.
- Add business context tags early. Customer tier, region, and feature flag state turn a generic trace into an actionable one.
- Tier your retention. Keep raw traces for 7 to 14 days, roll up aggregate metrics for 13 months or more, and archive logs to cold storage after 30 days.
- Always preserve error and outlier traces longer than routine successful ones. They're disproportionately valuable during postmortems.
How Should You Evaluate and Choose Monitoring Tools?
The managed-versus-self-hosted decision usually comes down to team size and operational appetite. Managed platforms cost more per unit of data but remove the burden of running a tracing backend at 3 a.m. Self-hosted stacks cost less at scale but only pay off if your team has the bandwidth to operate them, a tradeoff worth weighing against the total cost of ownership, not just the license fee.
- OpenTelemetry compatibility: can you switch vendors later without re-instrumenting every service?
- Trace and log correlation: can you jump from a trace span directly to the matching log line with one click?
- RUM and synthetic support: does the platform cover both, or will you need a second vendor?
- Alerting flexibility: can you build SLO-burn alerts, or only static thresholds?
- Pricing model: priced per host, per GB ingested, or per user? Each rewards a different usage pattern.
Pilot before you commit. Run a 30-day trial against one high-traffic service and measure two things: how fast an engineer can find a root cause using the tool, and what the projected bill looks like at your actual production volume, not the sales demo's sample data. A unified platform simplifies correlation but a specialized stack can still win on cost if your team can operate it confidently.
Your 30/90/180-Day Rollout Plan for Monitoring Maturity
Rolling out SLO-driven monitoring works best as a staged plan rather than a big-bang deployment. The pattern below follows what FiveNines documents as the practical sequence for maturing observability: instrument critical journeys first, enforce SLOs, then expand coverage.
- Days 1 to 30: inventory your five most critical user journeys, write initial SLOs for each, enable auto-instrumentation, and stand up basic synthetic checks on top transactions.
- Days 31 to 90: add distributed tracing across critical flows, convert alerts to SLO-burn logic, write runbooks for your top ten alert types, and build the three core dashboards.
- Days 91 to 180: tune sampling rates based on actual traffic and cost data, expand RUM coverage to secondary user segments, and automate safe remediation, such as auto-scaling or feature-flag rollback, where the blast radius is low.
Each phase builds on real production data from the previous one rather than guessing at coverage upfront.
Data Retention Policies and Storage Management
Observability data compounds fast, and a retention policy written after the storage bill triples is a policy written too late. The right approach tiers data by both age and diagnostic value rather than applying one blanket rule to everything you collect.
Raw traces are the most expensive and least useful after the first two weeks; keep them at full fidelity for 7 to 14 days, long enough to cover a typical incident postmortem window, then downsample or discard. Metrics compress well and stay useful far longer, so aggregate rollups (hourly or daily averages) can reasonably live for 13 months or more, letting you compare this quarter against the same quarter last year. Logs sit in the middle: keep them searchable for 30 to 90 days, then archive to cold storage where they're retrievable but not indexed.
Error and incident-related traces deserve an exception to every rule above. Extend retention for any trace tied to a declared incident or postmortem, regardless of age, since regulatory audits and root-cause reviews often reach back further than routine debugging ever does. Tag these explicitly at capture time rather than trying to find them later in a bulk export.
Storage cost scales with cardinality as much as volume. A metric with a high-cardinality label, such as raw user ID, can silently multiply your bill tenfold compared to the same metric tagged with a bounded value like customer tier. Audit your labels before you audit your retention windows, because the cheapest data hygiene fix is usually removing a label nobody queries.
Security and Privacy Considerations in Application Monitoring
Telemetry pipelines see everything the application sees, including data they were never meant to capture. Logs and traces routinely leak personally identifiable information: email addresses in URL parameters, names in error messages, session tokens in headers. Treat your observability pipeline with the same access controls you'd apply to the production database it's shadowing.
Scrub sensitive fields at the instrumentation layer, not after ingestion. Once a Social Security number lands in a log aggregator with a 90-day retention window, deleting it retroactively is far harder than never capturing it in the first place. Most APM SDKs support field-level redaction rules; configure them before your first production deploy, not after a compliance review flags the gap.
Access control matters as much as data hygiene. Not every engineer needs to query raw RUM sessions containing user IP addresses and device fingerprints. Role-based access, separating who can see aggregate dashboards from who can query raw traces, limits exposure without slowing down the people who actually need deep diagnostic access.
If your application handles regulated data (health records, payment details, EU resident data under GDPR), your monitoring vendor's data residency and processing terms matter as much as its feature set. Confirm where telemetry is stored and processed, not just where your application runs, and document that in your vendor evaluation checklist alongside the technical criteria.
Common Pitfalls and Anti-Patterns to Avoid
Most monitoring failures aren't caused by missing tools, they're caused by the ways teams misuse the tools they already have. A few patterns show up repeatedly across engineering organizations of every size.
Alerting on symptoms instead of user impact tops the list. A disk-usage alert that fires every night at the same time, regardless of whether users noticed anything, trains engineers to ignore pages. That trained ignorance eventually swallows the one alert that actually mattered.
Dashboard sprawl is the visual version of the same problem. Teams that add a panel every time someone asks "can we track X" end up with dashboards nobody trusts, because finding the signal buried in forty charts takes longer than just asking a colleague what broke.
Averages masking tail problems deserve their own callout.
Treating monitoring as a launch-day checkbox rather than a living practice causes the slowest kind of failure: dashboards quietly go stale, alert thresholds never adjust as traffic grows, and six months later nobody trusts the data enough to act on it during a real incident.
Monitoring Distributed and Microservices Architectures
A single user request in a microservices architecture might touch a dozen services before returning a response, and each of those services generates its own logs, metrics, and spans in isolation unless you deliberately connect them. Without context propagation, an incident review turns into a scavenger hunt across a dozen separate log streams with no shared thread.
Distributed tracing solves this by generating a trace ID at the entry point (typically the API gateway or load balancer) and propagating it through every downstream call, whether that's a synchronous HTTP request, an async message queue, or a gRPC call. OpenTelemetry's context propagation standard handles this across most common protocols out of the box, which is a large part of why it's become the default instrumentation layer for distributed systems.
Correlation goes beyond trace IDs alone. Tag every span, log line, and metric with consistent metadata, service name, version, deployment region, and environment, so an engineer can pivot from "this trace is slow" to "every instance of service version 2.4.1 in the EU region is slow" without manually cross-referencing three separate systems.
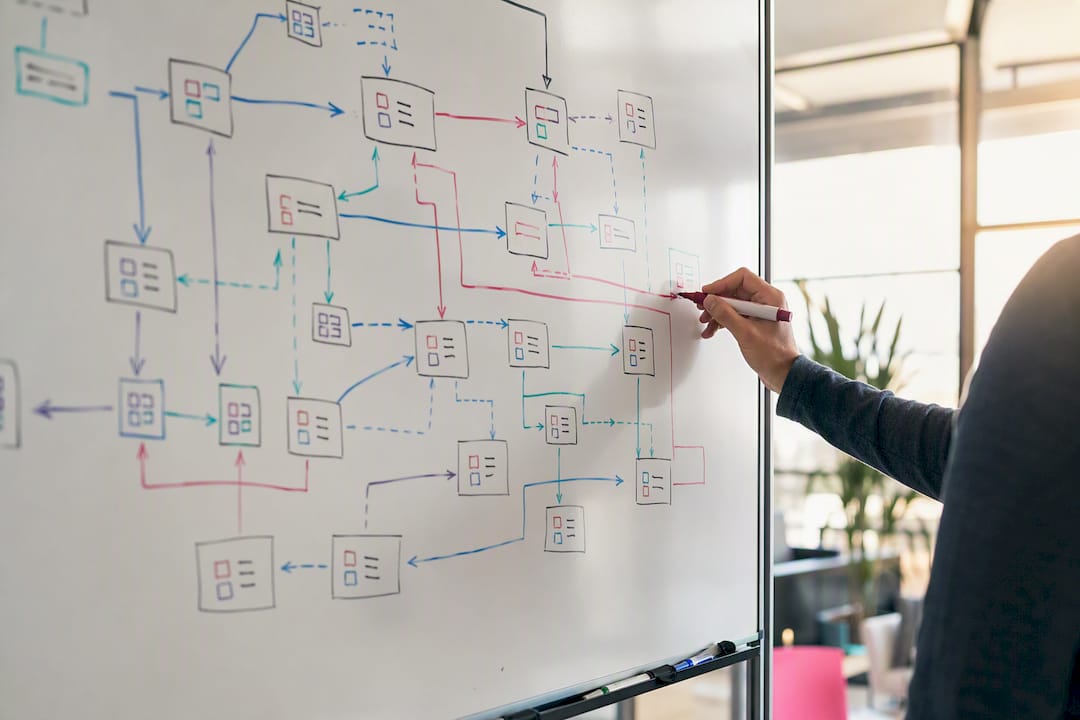
Service dependency mapping deserves specific attention in this context. As the service count grows past a dozen or so, manually tracking which services call which becomes impossible, and a dependency graph generated from actual trace data becomes the only reliable source of truth for understanding blast radius before you make a change.
What Requestum Has Learned Building Observable Systems
Requestum's engineering teams have wired instrumentation into projects ranging from AI-driven sports analytics to production mobile apps, and the pattern holds regardless of industry: the SLOs that matter get defined before a line of instrumentation code ships, not after. On an AI-powered performance analysis project, tracing decisions were shaped around which model inference calls actually affected user-facing latency, not which ones were easiest to instrument.
The recurring lesson worth repeating: rich telemetry has a runtime cost, and teams that skip that tradeoff conversation early usually pay for it later in either a slow application or an unreadable trace volume. Tagging spans with business context (customer tier, feature flag state) consistently outperforms capturing more raw data points. Precision beats volume almost every time observability data actually gets used during an incident.
— Dmitry
How Requestum Helps You Implement These Practices
Reading a checklist and shipping SLO-driven monitoring in production are two different projects, and most engineering teams are stretched too thin to do the second one properly while shipping features. Requestum builds the instrumentation, testing, and integration work that turns this article into a running system, not just a good intention.
Requestum's QA and testing services validate SLOs and alert logic before release, catching the gap between "the dashboard looks fine" and "the alert actually fires when it should." The automated testing team builds synthetic checks directly into CI/CD pipelines, so regressions get caught before a deploy, not after a customer complaint. For teams instrumenting new services from the ground up, web development engagements bake OpenTelemetry and trace propagation into the architecture from day one instead of retrofitting it under pressure. Start with an audit of your current telemetry coverage, or scope a pilot on one critical user journey, and take the first concrete step toward monitoring that actually earns your team's trust.
Sources
- When To Use Synthetic Monitoring vs. Real User Monitoring - The New Stack
- APM best practices: Dos and don’ts guide for practitioners | Elastic
- How to Monitor Application Performance: A Practical Guide | FiveNines