

A churn prediction model estimates each customer's probability of leaving within a defined window, so retention teams can rank accounts by risk and act before revenue walks out the door. The single most important first step isn't picking an algorithm. It's agreeing, in writing, on what "churn" means for your business and over what horizon, because a model built on a fuzzy label produces scores nobody trusts and nobody acts on.
TL;DR:
- Accurate churn labels and fixed prediction horizons are essential; fuzzy definitions lead to untrustworthy scores and poor actionability.
- Different churn types, such as voluntary versus involuntary or customer versus revenue churn, require tailored models like binary classification or survival analysis.
- Most effective models start with logistic regression or decision trees before moving to more complex options like gradient boosting or survival analysis, based on business needs.
- Evaluation metrics like AUPRC, precision at top decile, and calibration are far more meaningful than accuracy in imbalanced churn datasets; use chronological validation to prevent data leakage.
- Success relies on translating risk scores into specific, owner-assigned playbooks and measurable impact through controlled experiments, not on model complexity alone.
Table of Contents
- Defining the Churn Event Before You Touch a Model
- Types of Churn and Matching the Model to the Type
- Choosing a Model Architecture Based on the Business Question
- Evaluation Metrics and Validation That Won't Fool You
- From Score to Action: Playbooks and Measuring Real Uplift
- Deployment Patterns and a Practical Stack Example
- Turning Model Output Into Reason Codes People Can Act On
- Monitoring, Drift Detection, and When to Retrain
- Requestum's Experience Building Predictive Analytics Solutions
- Ethical Considerations and Bias Mitigation in Churn Models
- Privacy and Data Protection in Churn Modeling
- Churn Prevention Strategies Shaped by Prediction Insights
- Bringing External Data Into the Model
- What the Research Actually Supports
- How Requestum Can Help You Build and Deploy a Churn Model
- Sources
- FAQ
Defining the Churn Event Before You Touch a Model
Every strong churn prediction model starts with a business decision, not a data decision. You need a precise label and a fixed time horizon before a single feature gets engineered, because the model will faithfully learn whatever definition you feed it, even a bad one.
For subscription businesses, churn usually means cancellation or nonrenewal at the end of a billing cycle. For project-based B2B firms, churn is murkier. It might mean a client fails to start an expected next engagement, or goes inactive for longer than an agreed threshold, since there's no subscription to cancel. Microsoft's guidance on churn architectures frames this well: the label has to match how the business actually loses revenue, not a generic template borrowed from a different industry. For usage-based products, churn might be defined at the account level (the whole organization stops paying) or the user level (individual seats go dormant while the account survives). Those are different modeling problems with different features and different playbooks.
You also need to decide whether you're predicting customer churn or revenue churn. A model optimized to flag departing logos can miss the one enterprise account whose downgrade wipes out more revenue than fifty small cancellations combined.
Before any modeling work begins, get stakeholders in a room and lock down:
- The exact churn event (cancellation, nonrenewal, inactivity past X days, seat reduction)
- The prediction horizon (30, 60, 90 days out)
- The evaluation unit (account, user, or revenue-weighted)
- Who owns the "reachable" definition, meaning which flagged accounts customer success can actually contact
Skip this step and you'll spend months tuning a model that answers a question nobody asked.
Types of Churn and Matching the Model to the Type
Not all churn behaves the same way, and treating it as one monolithic problem is a common mistake. Voluntary churn happens when a customer actively decides to leave, canceling a subscription or declining to renew a contract. Involuntary churn happens when a payment fails, a card expires, or a billing error lapses an account the customer never intended to leave. These require entirely different interventions: voluntary churn needs relationship and value-focused outreach, involuntary churn needs a better dunning process and payment retry logic.
Customer-count churn and revenue churn also diverge in ways that matter for enterprise teams especially. Losing 100 small accounts might barely dent revenue, while losing three mid-market accounts to a downgrade can outweigh all of them. Revenue churn deserves its own tracked metric, separate from headcount attrition.
The modeling approach should follow from these distinctions:
- Binary classification works well when you need a simple "will they churn in the next N days" answer for prioritization.
- Survival analysis fits better when timing matters as much as likelihood, since it estimates time-to-churn rather than a single yes/no probability.
- Anomaly detection helps catch involuntary or unusual churn patterns, such as a sudden usage drop that doesn't match normal seasonal behavior.
Diagnostic churn analysis and prospective churn prediction are distinct workflows, and skipping the diagnostic step is a frequent cause of weak models. If you jump straight to prediction without first understanding why past customers left, the model tends to learn accidental correlations rather than causal, actionable drivers, according to research comparing diagnostic and predictive churn workflows.
Choosing a Model Architecture Based on the Business Question
The right model depends on what decision the score needs to support, not on which algorithm is trending. Model choice should follow the business decision: transparency needs versus raw predictive power versus timing sensitivity, according to Microsoft's churn modeling guidance.
- Logistic regression and decision trees remain the right starting point when stakeholders need to understand exactly why a score moved. A coefficient table is something a VP of customer success can question in a meeting; a black-box ensemble is not.
- Gradient-boosted trees like LightGBM or XGBoost handle nonlinear relationships and mixed feature types well, and they're usually the accuracy workhorse for tabular churn data once you have enough history and enough churners to train on.
- Survival analysis (Cox proportional hazards or its machine-learning variants) answers "when" rather than just "if," which matters when your retention team needs a countdown to plan outreach timing rather than a flat probability.
- Real-time models make sense only when your organization can act immediately on a triggered event, such as a failed payment or a support escalation. If your retention team runs weekly outreach cycles, a real-time model just adds infrastructure cost for no operational benefit.
- Deep learning can lift offline benchmark scores on domain-specific datasets with enough volume and structure, but a Scientific Reports study on custom deep-learning churn architectures found these gains don't automatically translate into retained revenue. Without business validation and time-aware testing, a fancier model can simply be a more expensive way to be wrong.
Most teams that succeed with churn modeling start with logistic regression as a benchmark, move to gradient-boosted trees once they've validated the feature set, and reserve survival analysis or real-time scoring for the specific use cases that actually need timing precision or immediate triggers. Jumping straight to the most complex option available is rarely the efficient path.
Evaluation Metrics and Validation That Won't Fool You
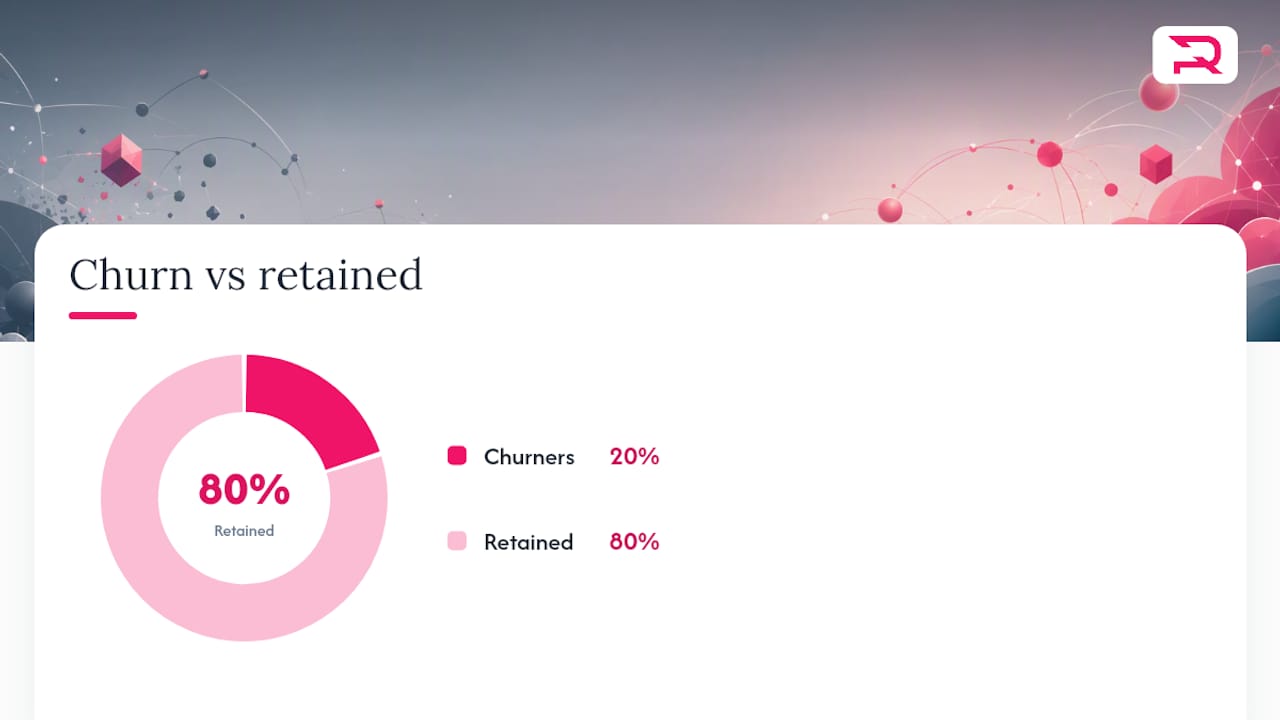
Raw accuracy is close to useless for churn prediction because the classes are almost always imbalanced. If only 20% of customers churn, a model that predicts "no churn" for everyone scores 80% accuracy while being completely worthless.
The imbalance problem in numbers: Microsoft's Fabric tutorial walks through a dataset of 10,000 customers with 2,037 churners, roughly 20% churn. That ratio is common across subscription businesses, and it's exactly the situation where accuracy misleads and precision, recall, and AUPRC tell the real story.
The metrics that actually matter for churn work:
- AUPRC (area under the precision-recall curve) rewards models that rank true churners highly, which is what you need when acting on the top of the list.
- Precision at top-decile tells you, of the riskiest 10% of accounts your model flags, how many genuinely churn. This maps directly to "how good is my priority list."
- Recall measures how many actual churners you caught, which matters when missing a high-value account is expensive.
- Calibration checks whether a predicted 0.80 probability actually corresponds to roughly 80% of that cohort churning. Stripe's guidance on churn modeling treats calibration as an operational requirement, not a nice-to-have, since uncalibrated scores mislead prioritization even when ranking quality looks fine.
- Lift compares your model's top segment against random selection, giving a quick sanity check on whether the model is worth the engineering effort.
Two validation habits separate models that work in production from models that only work in notebooks. First, use a chronological holdout rather than a random split, training on data through a cutoff date and validating on data after it, since a random split lets future information leak backward and inflates every metric you report. This is the same principle Bombora's churn prediction overview emphasizes when discussing forecasting generalization. Second, if you apply SMOTE or another resampling technique to address class imbalance, apply it only inside the training portion of each cross-validation fold. Resampling before the split leaks validation information into training and inflates your reported metrics in a way that won't survive contact with real data, a point backed by resampling research published in Scientific Reports.
One more number worth reporting alongside the standard metrics: how many of your flagged accounts are actually reachable. A model with excellent AUPRC is not very useful if customer success can only contact 50 accounts a week and your top-risk list has 400 names on it.
From Score to Action: Playbooks and Measuring Real Uplift
A risk score by itself changes nothing. The value of a churn prediction model comes entirely from what happens after the score gets generated, and that means building a bridge from probability to action.
- Map risk level and reason code to a specific playbook. A high-risk account flagged for declining usage needs a different response than one flagged for a failed payment. Each playbook needs a named owner and a deadline, not a vague instruction to "reach out."
- Prioritize by reachable capacity, not raw risk score. If your team can work 60 accounts this week, rank by expected retained revenue divided by intervention cost, not just churn probability. A $2,000/year account and a $200,000/year account with the same risk score deserve very different levels of effort.
- Design a controlled holdout before rolling out any intervention broadly. Split flagged accounts into a treated group and a holdout group that receives no special outreach, then compare retention rates after 60 or 90 days.
This last step is the one teams skip most often, and it's the one that actually proves the model paid for itself. Bombora's core concepts guide is direct about this: a risk score is not a retention strategy on its own, it needs mapped playbooks and, where possible, controlled measurement of incremental impact. Without a holdout, you can't tell whether retained customers stayed because of your intervention or would have stayed anyway.
Playbooks tend to cluster into a handful of categories: executive alignment calls for strategic accounts showing disengagement, quality-improvement escalations for accounts with rising support ticket volume, delivery-recovery plans for accounts behind on onboarding milestones, and roadmap workshops for accounts whose usage suggests they've outgrown their current plan. Complementary retention tactics, like the ones outlined in this guide to proven customer retention strategies, can inform how you design the outreach itself once the model tells you who to prioritize.
Pro Tip: Track "expected retained revenue per hour of customer-success effort" as your north-star metric for the whole program. It forces every playbook decision through a cost-benefit lens instead of a gut feeling about which accounts "seem important."
Deployment Patterns and a Practical Stack Example
Batch scoring covers most churn use cases well. Running predictions nightly or weekly against your full customer base is enough for the majority of retention programs, where outreach happens on a similar cadence anyway. Streaming inference, where a model scores an event the moment it happens, only earns its complexity when you have a genuinely time-sensitive trigger, like scoring a payment failure the instant it occurs so a retry or recovery email fires within minutes.
A reference stack that shows up repeatedly in production churn systems, and one you can treat as a template rather than a rulebook:
- Feature pipeline: a data warehouse feeding scheduled transformations, built in pandas or a SQL-based transformation layer.
- Training libraries: scikit-learn for baselines and preprocessing, LightGBM for the production-grade gradient-boosted model.
- Experiment tracking: MLflow to log model versions, hyperparameters, and metrics so you can compare runs and roll back cleanly.
- Serving layer: a lightweight API endpoint or scheduled batch job that writes scores back into the warehouse.
- Business-facing layer: a BI tool like Power BI or a CRM integration that surfaces scores where account managers already work.
Microsoft's own churn tutorial walks through almost exactly this combination, pairing pandas and LightGBM with autologging and business reporting tools. Teams without in-house data infrastructure sometimes underestimate the engineering cost of the "boring" middle layer, the feature pipeline and the serving API, which usually takes longer to build correctly than the model itself. That's often the point where bringing in a partner familiar with predictive analytics development shortens the path from prototype to something account managers actually use daily.
Turning Model Output Into Reason Codes People Can Act On
A churn score without an explanation is a number customer success teams learn to ignore within a month. The operational deliverable isn't the probability, it's a reason, an owner, a suggested next action, and a deadline attached to every flagged account.
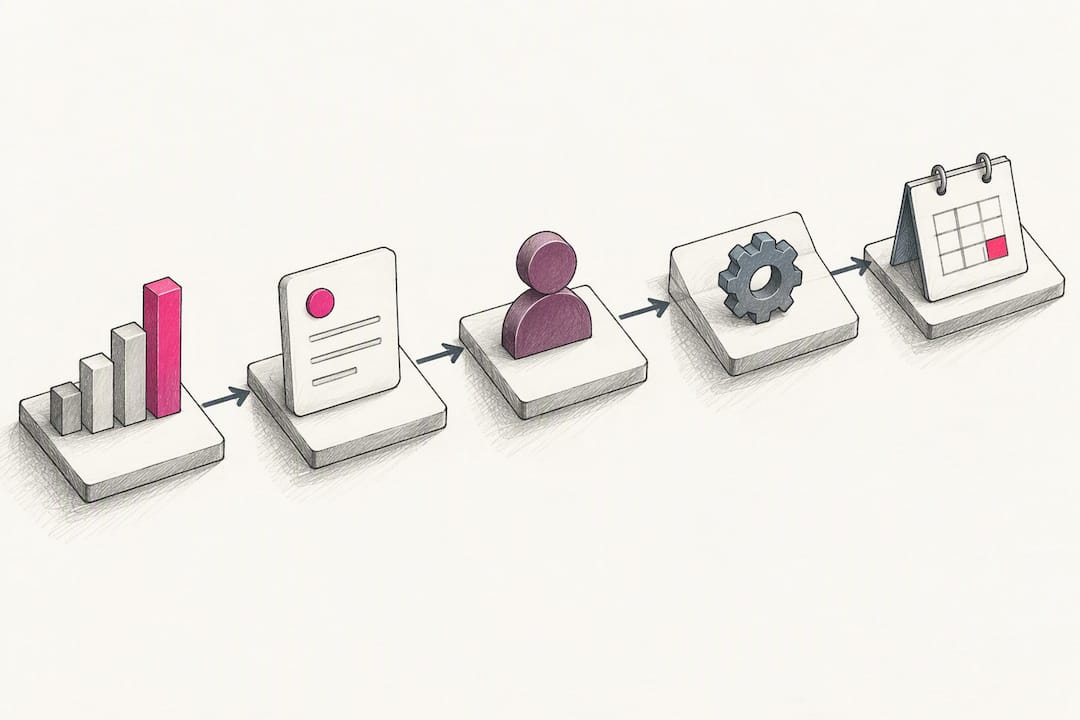
SHAP (SHapley Additive exPlanations) is the most reliable technique for generating that reason. Pairing a gradient-boosted model with SHAP values exposes which features pushed a specific account's score up, turning "72% churn risk" into "72% churn risk, driven primarily by a 40% drop in login frequency and two unresolved support tickets." Research on interpretability in predictive models confirms this combination gives customer-facing teams something they can actually act on instead of a black-box number to distrust.
Other interpretability approaches fill in around SHAP:
- Global feature importance gives a quick sanity check on which signals drive the model overall, useful for stakeholder presentations.
- Surrogate rules, simple decision trees trained to mimic the complex model's output, work well for explaining behavior to non-technical audiences without exposing the full model internals.
- Humanized reason text, generated by mapping SHAP outputs to plain-language templates, tends to land better with account managers than raw feature names and coefficients.
The right output format is a weekly account-risk table pushed into the CRM, with columns for account name, risk score, top two reason codes, assigned playbook, owner, and deadline. That table, not a model accuracy report, is what a customer success leader should see every Monday morning.
Pro Tip: Resist the urge to show raw feature names like "days_since_last_login_delta_90" to account managers. Translate every SHAP output into a plain sentence before it reaches a CRM dashboard, or the explanation layer becomes just as opaque as the score it was meant to clarify.
Monitoring, Drift Detection, and When to Retrain
Every churn prediction model decays. The question is whether you notice before or after it starts sending your retention team after the wrong accounts.
Track precision at the top decile on a rolling basis, since a drop there means your priority list is getting noisier even if overall accuracy looks stable. Check calibration by cohort, not just in aggregate, because a model can stay well-calibrated for long-tenure customers while drifting badly for new signups. Watch for feature-distribution drift, meaning the input data itself is shifting in ways the model was never trained on, such as a product change that alters what "normal" usage looks like. And tie model performance back to a business KPI, like retained revenue in the holdout group, since a model can look statistically healthy while quietly failing to move the metric that justified building it.
Retraining cadence should follow your business's own rhythm, not an arbitrary calendar. A business with strong seasonal patterns needs retraining aligned to that cycle; a business with a steady enrollment pattern can often run quarterly. Keep an experiment log and clear model lineage so you always know which model version produced which score, and consider canary scoring, meaning a new model version gets tested on a small slice of traffic before full rollout, with rollback ready if performance drops below a set threshold tied to actual business impact rather than a purely statistical one.
Requestum's Experience Building Predictive Analytics Solutions
Requestum's data science team has built predictive analytics solutions that follow the same discipline outlined above: precise problem definition, rigorous feature engineering, and evaluation tied to business outcomes rather than leaderboard metrics. The company has a track record across AI and data science engagements for clients solving operationally complex problems.
The Demand Forecasting Solution built for a transportation services client illustrates a transferable pattern: structured feature pipelines, model prototyping, and integration into business systems that decision-makers already use daily. The same architecture, feature engineering, model prototyping, deployment, dashboard integration, translates directly to churn work.
A typical churn engagement runs through discovery to define the label and horizon, feature-pipeline construction, model prototyping and validation, deployment into existing CRM or BI tools, and a structured A/B holdout to confirm retention lift before full rollout.
Ethical Considerations and Bias Mitigation in Churn Models
A churn prediction model can quietly encode unfair patterns if the training data reflects historical biases in how customers were treated. If certain demographic groups received worse support response times in the past, a model trained on that history may learn to associate those groups with higher churn risk for reasons that have nothing to do with genuine dissatisfaction, and everything to do with how they were served.
The practical fix starts with auditing which features correlate with protected or sensitive characteristics, even indirectly. Zip code, for instance, can act as a proxy for income or race in ways that aren't obvious until you check. Run fairness checks across demographic segments before deployment, comparing false positive and false negative rates between groups rather than assuming aggregate accuracy tells the whole story.
There's also a subtler ethical question specific to churn: what you do with the score matters as much as the score itself. Using churn predictions to identify at-risk customers for better service is defensible. Using the same predictions to deprioritize support for customers unlikely to churn anyway, effectively punishing loyalty with worse service, crosses into territory that can damage trust and invite regulatory scrutiny in some industries.
Document your fairness testing process the same way you document model performance. If a regulator, auditor, or customer ever asks how risk scores are generated and applied, "we didn't check" is not an acceptable answer, and increasingly, it's not a legally safe one either.
Privacy and Data Protection in Churn Modeling
Churn models run on exactly the kind of data that privacy regulations were written to protect: behavioral logs, payment history, support communications, and sometimes location or device data. Treat every feature source with the same scrutiny you'd apply to any system handling personal data, because a churn model is, functionally, a system that profiles individual customers.
Data minimization matters here more than it might seem. Just because a field is available in your warehouse doesn't mean it belongs in a churn model. Include only the features that demonstrably improve prediction quality, and be ready to justify each one if asked.
Retention and deletion policies need to extend to model artifacts, not just source data. If a customer requests deletion of their data under applicable privacy law, your process needs to account for whether their information persists in training datasets, feature stores, or model weights, not just the primary customer database.
Access controls on churn scores deserve attention too. A risk score is sensitive information about a customer relationship, and it shouldn't be visible to anyone beyond the teams who need it to act. Build audit logging into who accessed which scores and when, especially for organizations operating across multiple jurisdictions with different data protection requirements. Getting this right the first time is considerably cheaper than retrofitting compliance after a system is already in production.
Churn Prevention Strategies Shaped by Prediction Insights
The best churn prediction models don't just flag risk, they reveal patterns that reshape how a business operates before risk even develops. Reason codes aggregated across hundreds of flagged accounts tend to surface systemic issues that no individual customer complaint would expose on its own.
If a large share of high-risk accounts share a specific onboarding gap, that's a signal to fix the onboarding flow itself, not just to intervene account by account after the fact. Prevention beats reaction, and a well-built churn model is one of the few tools that shows you where prevention will pay off before the damage is done.
Proactive strategies informed by these patterns tend to fall into a few buckets. Usage-based nudges, automated check-ins triggered the moment engagement drops below a threshold, catch disengagement early rather than after a cancellation email arrives. Success milestones, tracking whether customers reach specific value markers within their first 90 days, correlate strongly with long-term retention across many subscription businesses. Proactive billing communication, reaching out before a payment fails rather than only after, addresses involuntary churn before it happens rather than trying to win back a lapsed account.
The connective tissue between prediction and prevention is feedback. Every retention outcome, whether an intervention worked or failed, should flow back into how you interpret future scores and refine which reason codes actually predict recoverable churn versus which ones predict a decision that was already final.
Bringing External Data Into the Model
Internal usage and billing data tell you what a customer is doing. External data can tell you why, and that context often improves prediction accuracy in ways internal signals alone can't reach.
Market and industry trend data helps distinguish company-specific risk from sector-wide pressure. A customer cutting software spend during a broad industry downturn presents a different risk profile than one cutting spend while competitors in the same sector are expanding. Firmographic signals, funding events, leadership changes, hiring freezes, layoffs, often precede budget cuts by weeks or months, giving genuine lead time before usage metrics show any decline at all.
Competitor activity matters too, particularly for B2B software where switching costs are real but not prohibitive. A sudden spike in usage decline across accounts in one industry vertical, correlated with a competitor's product launch or aggressive pricing move, is a pattern internal data alone will never surface. Third-party intent data providers track exactly these kinds of signals, and folding them into a feature set can catch risk that would otherwise only show up after the customer has already mentally checked out.
The tradeoff is cost and integration complexity. External data sources typically require paid subscriptions and ongoing data pipeline maintenance, so the decision to add them should follow the same cost-benefit logic as everything else in this process: does the accuracy gain justify the added expense and complexity, or does the marginal lift not clear that bar for your particular business and customer base?
What the Research Actually Supports
The conventional advice on churn modeling spends too much time on algorithm selection and not nearly enough on the plumbing between a score and a human being who acts on it. Teams read about gradient boosting and SHAP values, build something reasonably accurate, and then watch it sit unused because nobody defined who owns a flagged account or what they're supposed to do about it.
The evidence throughout this piece points to a clearer priority order than most guides admit. Get the churn label and horizon right first, because a well-tuned model answering the wrong question is worse than a rough model answering the right one. Validate chronologically, not randomly, because a model that looks great on a shuffled test set can fall apart the first week it faces real forward-looking data. And build the playbook layer with the same rigor as the model layer, since Bombora's own framing makes clear that a score without a mapped action is just an interesting statistic.
Where I'd push back on common practice: teams chase model complexity long before they've exhausted the value of better feature engineering and cleaner labels. A logistic regression with well-designed recency and trend features will usually outperform a poorly-fed neural network, and it will do so while remaining explainable to the people who have to act on it.
— Dmitry
How Requestum Can Help You Build and Deploy a Churn Model
We build the layer most churn projects underestimate: the pipeline connecting raw usage, billing, and support data to a working model that actually lands inside the tools your account managers use every day.
That's the practical advantage over trying to stitch this together internally with a small team stretched across other priorities. Requestum's data science and predictive analytics teams handle the full path from discovery, defining your churn label and horizon with your stakeholders, through feature-pipeline construction, model prototyping, deployment, and CRM integration, followed by an A/B holdout to confirm the model actually retains revenue before you scale it company-wide. For SaaS businesses specifically, this often connects directly with broader SaaS development work already underway, so the churn model becomes part of the product rather than a bolted-on side project. If you're weighing whether to build this internally or bring in a team that's already solved the feature-pipeline and deployment problems before, reach out through Requestum's AI development services page to scope a discovery conversation.
Sources
For hands-on implementation, Microsoft's Fabric churn tutorial walks through a complete workflow with real code. Library documentation for LightGBM, scikit-learn, MLflow, and SHAP covers the technical details this article couldn't fit. Bookmark Stripe's guide to building a churn model for calibration guidance you'll want to revisit once your model reaches production.
- Customer churn — Microsoft Fabric (architectures)
- Customer churn prediction — Bombora Core Concepts
- How to build a customer churn model — Stripe
- Scientific Reports study on custom deep-learning churn models (2024)
FAQ
What Is a Churn Prediction Model, Exactly?
A churn prediction model is a statistical or machine-learning system that estimates each customer's probability of leaving within a defined time window, based on patterns in usage, billing, and support data. It ranks accounts by risk so retention teams can prioritize outreach before cancellation happens rather than after.
Which Metric Matters Most for Imbalanced Churn Data?
AUPRC and precision at the top decile matter more than raw accuracy, because accuracy gets skewed when churners represent a minority class, often around 20% of customers in typical subscription datasets, as shown in Microsoft's Fabric tutorial. Calibration and recall should be reported alongside these to avoid an overly optimistic read on model quality.
How Often Should a Churn Model Be Retrained?
Retraining cadence should follow your business's seasonality and any observed drift in precision at the top decile or feature distributions, rather than a fixed arbitrary schedule. Many teams retrain quarterly as a baseline and add unscheduled retraining whenever monitoring flags a meaningful drop in calibration or ranking quality.
Can Requestum Build a Custom Churn Prediction Model?
Yes, Requestum's data science and AI development teams build custom churn prediction models, from churn-label definition through feature engineering, model deployment, and CRM integration. Pricing for AI development engagements is available on Requestum's AI development services page, and specific project quotes depend on scope and data readiness.
Do I Need Deep Learning to Predict Churn Accurately?
Not usually. Gradient-boosted trees like LightGBM typically perform well on tabular churn data, and a Scientific Reports study on deep-learning churn architectures found that added model complexity doesn't automatically translate into retained revenue without proper business validation.